

Headless CMS: What it is and why it matters for modern marketers
Welcome Software
MAY 15, 2025
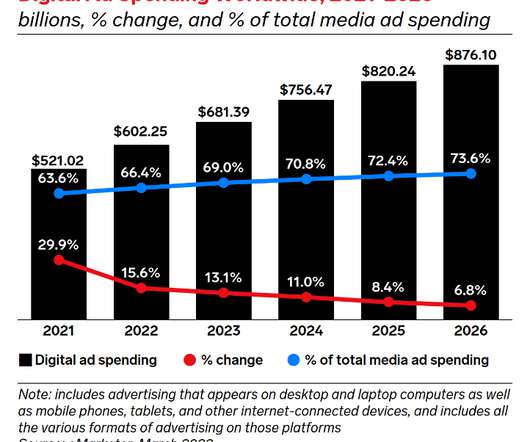
By 2026, Gartner predicts that 70% of organizations will prioritize acquiring composable Digital Experience Platform (DXP) technology over monolithic suites, up from 50% in 2023. personalization, A/B testing, analytics) Pro tip: Make sure the flexibility is worth the investment, especially if your current CMS already covers your core needs.


Let's personalize your content